
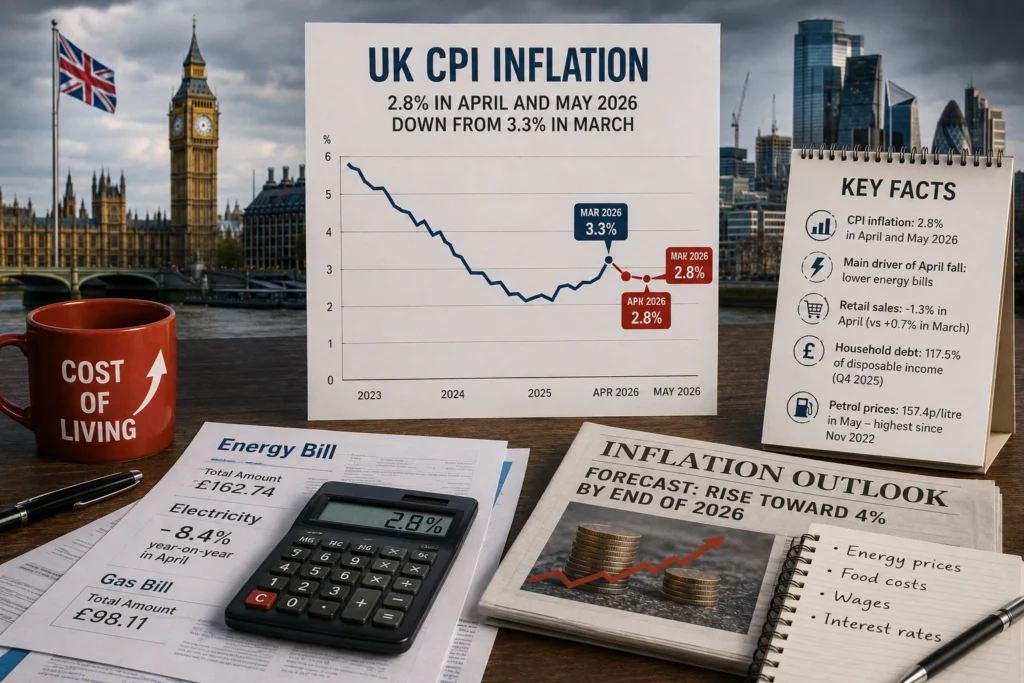
UK CPI inflation fell to 2.8% in the 12 months to April 2026, down from 3.3% in March, and held
at that level in May, according to the Office for National Statistics. The drop was largely driven by
lower household energy bills, partially offset by rising motor fuel prices. Economists note the figure
is also flattered by a base effect: prices in April 2025 were unusually high due to a cluster of bill
increases that month, making year-on-year comparisons look smaller than they would otherwise.
The respite is expected to be short-lived. Most economists forecast inflation will climb back toward
4% by the end of 2026 as the economic fallout from the conflict involving Iran feeds through to
energy markets. The Bank of England’s own projection, based on energy market pricing in mid-
April, put CPI at 3.1% in Q2, 3.3% in Q3, and rising further in Q4 due to higher energy and food
costs. Before the conflict began, inflation had been expected to fall to around 2% from April and
stay close to target for the rest of the year.
Core inflation (excluding energy, food, alcohol and tobacco) eased to 2.5% in April before edging
up to 2.6% in May. Within that, the picture is mixed: goods inflation has been rising (from 2.1% to
2.4%), while services inflation — which the Bank of England watches closely as a gauge of
domestic price pressure — has been falling, down from 4.5% in March to 3.2% in April, before
ticking back up to 3.7% in May.
On the household side, the Office for National Statistics’ wage data shows pay continuing to
outpace inflation only modestly. Retail sales volumes fell 1.3% month-on-month in April, reversing
a 0.7% rise in March. Household debt stood at 117.5% of disposable income at the end of 2025 — a
ratio that has generally been falling since 2022, though it remains historically elevated.
Key Facts:
CPI inflation: 2.8% in the 12 months to April 2026 (down from 3.3% in March); unchanged
at 2.8% in May
CPIH (includes housing costs): 3.0% in April and May 2026, down from 3.4% in March
Core CPI (excl. energy, food, alcohol, tobacco): 2.5% in April, rising to 2.6% in May
Services inflation: fell from 4.5% (March) to 3.2% (April), then rose to 3.7% (May) —
closely watched by the Bank of England as the more “domestic” inflation signal
Goods inflation: rose from 2.1% to 2.4% between March and April
Main driver of the April fall: lower household energy bills (electricity prices fell 8.4% y/y in
April)
Forecast: Bank of England projects CPI at 3.1% (Q2), 3.3% (Q3), rising further in Q4 2026,
driven by the Iran-conflict energy shock
Food price inflation: 3.0% in April, easing to 2.2% in May — lowest since December 2024
Retail sales: -1.3% month-on-month in April 2026 (vs +0.7% in March)
Household debt: 117.5% of disposable income (Q4 2025), down from recent peaks but still
historically high
Petrol prices: 157.4p/litre in May 2026 — highest since November 2022
Expert Insight (SWRR Centre):
The headline drop to 2.8% is a useful reminder that single-month inflation readings can be
misleading without context. Part of the fall is a genuine response to lower energy bills, but part of it
is a statistical base effect from an unusually high April 2025 — and the figure held flat rather than
continuing to fall in May, with core and services measures actually ticking back up. Forecasters and
the Bank of England itself are already signalling that this is a pause rather than a trend, with
inflation expected to approach 4% later in the year as the Iran-conflict energy shock works through
the system.
The divergence between goods and services inflation is also worth tracking. Services inflation is
considered more persistent because it reflects domestic costs — wages, rents, and local pricing
power — rather than imported price shocks. Its renewed uptick in May, even as headline CPI held
steady, suggests underlying domestic price pressure has not eased as much as the topline number
implies.
The retail sales fall and continued high household debt levels point to a consumer sector under
sustained strain even before the next anticipated inflation rise. A household debt ratio of 117.5% of
disposable income, even on a declining trend, leaves limited room for absorbing a further cost-of-
living shock — a relevant data point for anyone assessing household resilience heading into a
period of renewed price pressure.
Sources:
Office for National Statistics — “Consumer price inflation, UK: April 2026,” published May 2026
Office for National Statistics — “Consumer price inflation, UK,” latest bulletin (May 2026 data)
House of Commons Library — “Inflation in the UK: Economic indicators,” updated June 2026
House of Commons Library — “Economic Indicators,” CBP-9040, published May 27, 2026